BI & Analytics

BI & Analytics

Transform scattered data into clear, confident decisions with real-time dashboards, predictive insights, and unified reporting.

Real-time insights Governance ready Unified data model

Insight Snapshot

Typical outcomes within 90 days

Faster decisions 3.2x
Reporting time cut -55%
Data accuracy 99.5%
Adoption lift +68%
Centralized data warehouse
Executive dashboards
Forecasting models

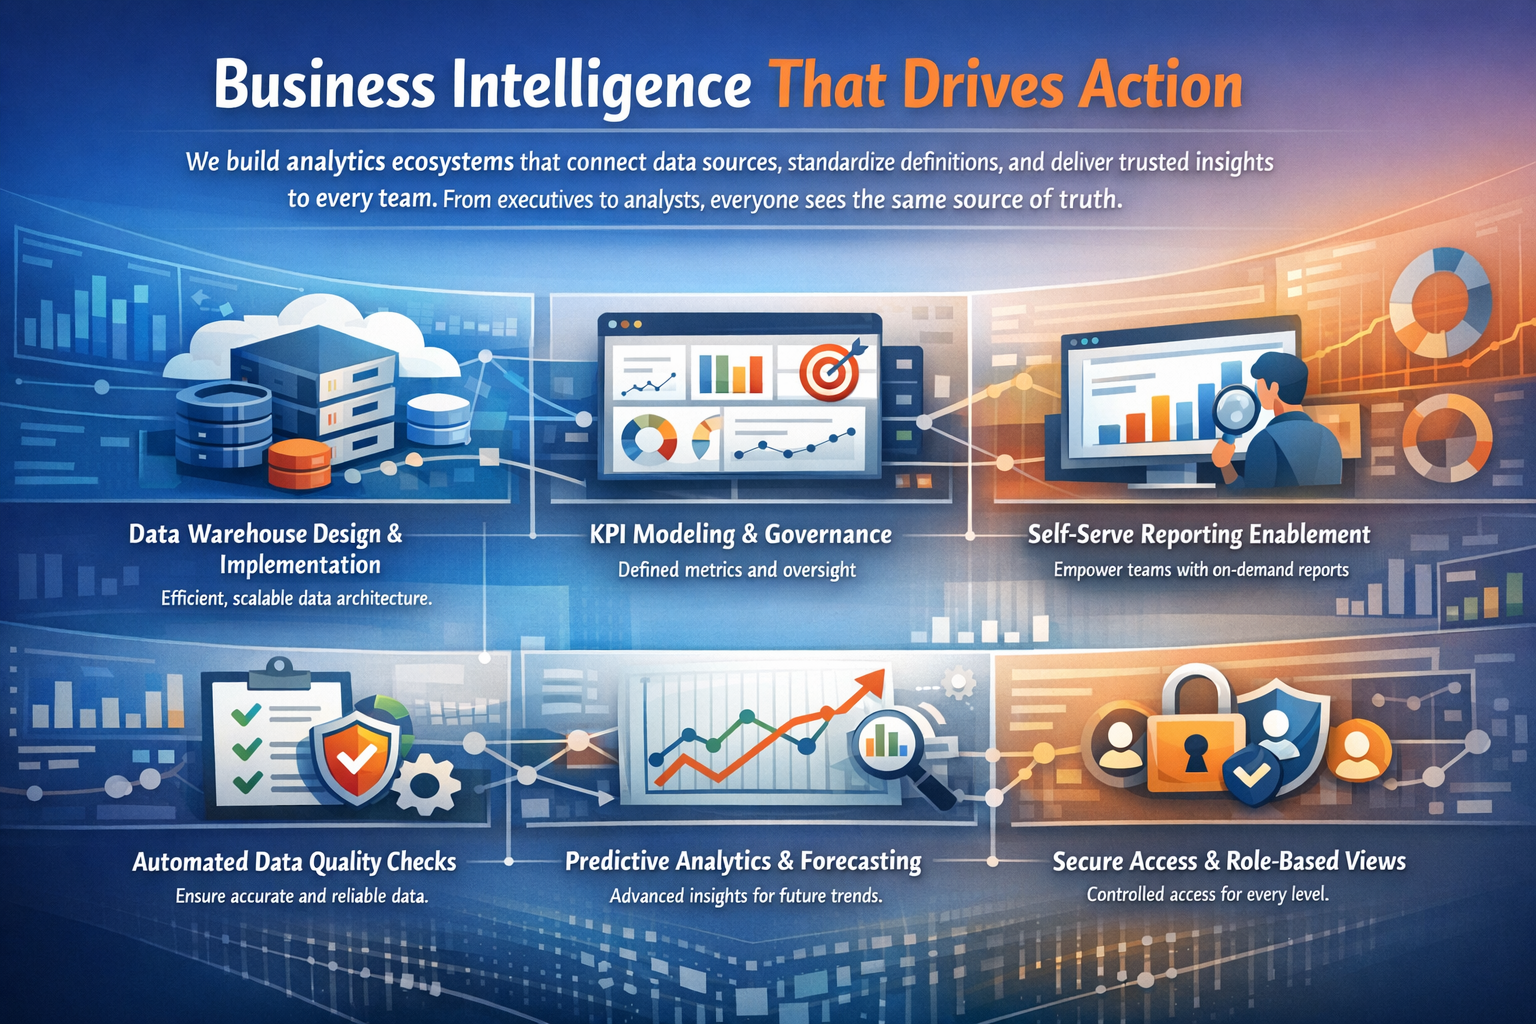
Business Intelligence That Drives Action

We build analytics ecosystems that connect data sources, standardize definitions, and deliver trusted insights to every team. From executives to analysts, everyone sees the same source of truth.

  • Data warehouse design & implementation
  • KPI modeling and governance
  • Self-serve reporting enablement
  • Automated data quality checks
  • Predictive analytics and forecasting
  • Secure access and role-based views
BI & Analytics

Business Intelligence Capabilities

Designed to deliver clarity, speed, and confidence across your organization.

Data Modeling

Unified schemas that simplify reporting and ensure consistent KPIs across teams.

Executive Dashboards

Interactive, role-specific dashboards with drilldowns for fast decision-making.

Advanced Analytics

Predictive models and trend analysis that uncover growth opportunities.

Governance & Security

Access controls, audit trails, and data lineage built into every layer.

Analytics Stack

We integrate best-in-class tools to match your data environment.

Power BI Tableau Looker Snowflake BigQuery Redshift PostgreSQL Spark dbt Airflow

Our Delivery Workflow

From discovery to adoption, we build analytics that stick.

01

Discovery

Define KPIs, stakeholders, and data sources.

02

Data Foundation

Build pipelines, models, and data quality checks.

03

Dashboards

Create role-based dashboards with guided insights.

04

Adoption

Train teams, iterate, and scale reporting.

Business Intelligence Use Cases

Practical analytics outcomes tailored to your business domain.

Revenue Operations

Pipeline visibility, forecast accuracy, and sales velocity metrics.

Supply Chain

Demand planning, inventory optimization, and supplier performance.

Customer Experience

NPS tracking, churn prediction, and cohort behavior analysis.

Finance & Risk

Variance analysis, compliance reporting, and anomaly detection.

Our BI & Analytics Technology

Enterprise-grade platforms for data visualization, reporting, and insights.

BI Platforms

  • Tableau
  • Power BI
  • Looker
  • Qlik
  • Sisense

Data Visualization

  • D3.js & Plotly
  • ECharts
  • Highcharts
  • Apache Superset
  • Grafana

Data Warehousing

  • Snowflake
  • BigQuery
  • RedShift
  • Azure DW
  • Data Lakes

ETL & Data Integration

  • Apache Airflow
  • Talend
  • Informatica
  • dbt
  • Spark

Advanced Analytics

  • Python & R
  • Statistical Analysis
  • Predictive Modeling
  • Data Mining
  • Forecasting

Real-Time & Streaming

  • Apache Kafka
  • Flink
  • Kinesis
  • Event Streaming
  • System Monitoring

Why Ainvnt for BI & Analytics

Turn data into actionable insights and competitive advantages.

3+
Years BI Experience
50+
Data Professionals
150+
BI Implementations

Data Strategy

Define KPIs, metrics, and data governance that align with business objectives and enable data-driven decisions.

Data Integration

Connect disparate systems, data sources, and clean data into a single source of truth for analysis.

Custom Dashboards

Beautiful, interactive dashboards that help stakeholders understand performance and make faster decisions.

Predictive Insights

Move beyond historical reporting. Build forecasting models and anomaly detection for proactive decision-making.

Team Training

Empower your team with data literacy and BI tool expertise for self-service analytics and independence.

Ongoing Support

Managed BI services with updates, optimization, and new feature development aligned with business growth.

Business Intelligence Success Stories

Real impact from better data visibility and insights.

↑ 35% Productivity

"Ainvnt built an interactive dashboard that replaced manual reporting. Analysts now spend 35% less time on reporting and focus on insights instead. ROI in 6 months."

Retail Chain
— Analytics Manager
↓ 50% Decision Time

"Their Tableau implementation gave us real-time dashboards. Decision cycles that took weeks now take hours. Faster insights mean faster action and competitive advantage."

Financial Services
— CFO
+25% Revenue

"Their predictive BI model identified customer churn patterns. We now retain 25% more high-value customers through proactive engagement based on data signals."

SaaS Company
— VP Growth

Our Business Intelligence Process

From data chaos to structured insights in systematic phases.

1

Discovery & Planning

Understand data sources, define KPIs, and create a BI roadmap aligned with business goals.

2

Data Integration

Connect, transform, and load data from multiple sources into a centralized data warehouse.

3

Dashboard Development

Build interactive dashboards and reports tailored to each stakeholder's needs and preferences.

4

User Training

Train teams on BI tools, data interpretation, and self-service analytics best practices.

5

Launch & Rollout

Deploy dashboards to production and manage organization-wide adoption with change management.

6

Optimization & Support

Continuous optimization, new features, and managed services to maximize BI value over time.

Frequently Asked Questions

Common questions about business intelligence and data analytics.

How long does BI implementation take

Simple implementations take 2-4 months. Complex enterprise projects take 6-12 months. We deliver value incrementally with phased dashboards, so you see ROI quickly.

Which BI tool should we choose

It depends on your data volume, budget, and team skills. Tableau excels at dashboards. Power BI offers Microsoft integration. Looker provides data modeling. We recommend the best fit for your use case.

What about data quality and governance

Critical. We establish data governance, master data management, and quality checks to ensure dashboards show reliable insights. Bad data = bad decisions.

Can we scale to handle real-time data

Absolutely. We design scalable architectures with streaming platforms (Kafka, Flink) for real-time dashboards that update by the second, not by the day.

How to ensure dashboard adoption

Change management, user training, and involving stakeholders early. Beautiful dashboards + executive sponsorship + ongoing support = high adoption rates.

Ready to Start Your Project?

Talk with our team about your goals, timeline, and the best path forward.

Contact Us Today